

New map aims to show risk of Coronavirus across Moray and rest of Scotland
Register for free to read more of the latest local news. It's easy and will only take a moment.

A new interactive map has been published which ranks the risk of coronavirus transmission in all 354 of Scotland's local authority wards.
In the Moray area, the highest-placed ward is Elgin City North at 207th, while the lowest is Heldon and Laich at 293rd.
The online map is viewable here
It has been been created by the analytics firm Scotianomics who are based in Glasgow and have used existing data to calculate each area’s risk of exposure.
The organisation says its map could help guide Scottish Government policy on lifting lockdown restrictions on a phased, geographic basis.
The data used to compile the map includes population density, the number of older people or those with underlying health conditions.
It also uses how many people travel by road and rail, how many access local health services.
In addition, it also takes into account socio-economic factors such as the average incomes of residents.
Gordon MacIntyre-Kemp, founding director of Scotianomics, stressed that the map
was not a record of COVID-19 cases across Scotland and does not imply that some
places necessarily have more cases than others.
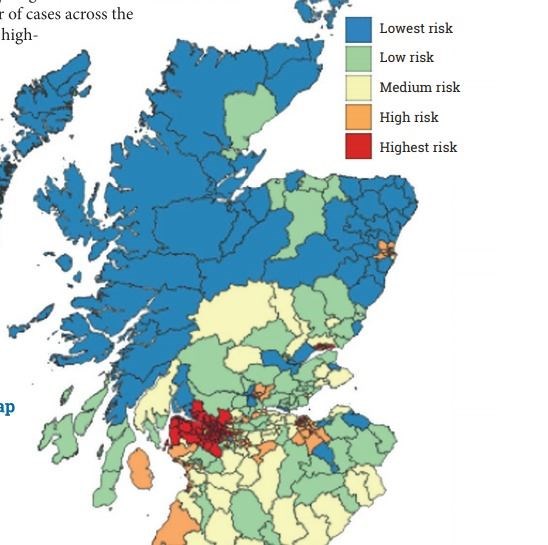
Rather, he stated, the map showed primarily how easy it might be for the virus to spread in particular communities, due to their population, connectivity and economic characteristics.
He said: "The public and business reaction to coronavirus is highly-charged and often emotional.
"We believe this geographic breakdown can help the national response to provide clear analysis of existing data
"What is evident is that, for a wide variety of reasons, the risks vary hugely in different communities across Scotland.
"In terms of both the economy and health and wellbeing, we believe it makes sense to ease the lockdown according to those regional differences in risk.
"There has already been a great deal of debate on whether the four nations within the UK should ease restrictions in lockstep, despite the fact that Oban is likely to have a completely different risk profile to Tower Hamlets in London.
"What our research shows is that there are also significant variations even within Scotland.
"Across the world, other countries, including China, Italy and Germany, responded to the initial threat on a regionalised basis and are now lifting lockdown according to regional variations.
"Our research suggests this is the most likely way to prevent a second wave and to protect the economy."
The research was conducted during April and has been submitted to the Scottish Government’s advisory group on economic recovery.
Currently, the research does not factor in actual infection rates or fatalities which may have been recorded in each area as these figures are not publicly available in sufficiently detailed form.
Scotianomics has pledged that it will update the online tracker as new datasets become available.
"We want to be absolutely clear," Mr MacIntyre-Kemp said.
"This is nothing to do with the number of cases in an area or how well people living in each area have observed the lockdown.
"It is not a map of Covid-19 cases across Scotland but of the areas most at risk of community infection.
"However, what it sets out very clearly is that the risks of transmission and the likelihood of fatalities within particular communities can be predicted with a high degree of confidence."
Read more news from Moray here